Issuances
Ryskview tracks issuances directed by the DoD for users to quickly identify and remediate vulnerabilities to comply with DoD guidelines. The Information Assurance Vulnerability Management (IAVM) is a DoD program that aims to maintain the security posture of DoD systems by identifying, mitigating, and monitoring vulnerabilities. The Issuance dashboard lists the IAVMs and other DoD guidelines.
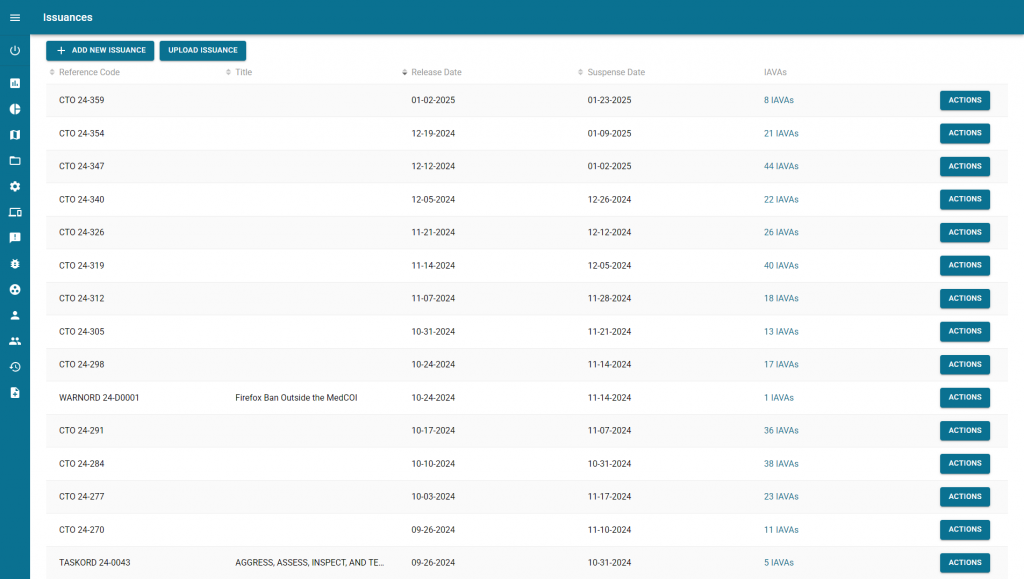
The image above is of the Issuances page in Ryskview. The breakdown of the column headers are as follows:
- Reference Code – The Reference Code to the DoD Issuance.
- Title – The tile of the Issuance. This field is optional.
- Release Date – The date the Issuance was released.
- Suspense Date – The projected date the Issuance should be fulfilled.
- IAVA – The associated IAVMs of the Issuance.
IAVAs
Selecting the number of IAVAs for a specific Issuance will take users to the Issuance Profile Page. Here users are able to review the IAVAs, and their associated vulnerabilities. The table displays the IAVM reference code, the title, release date, suspense date, and number of associated vulnerabilities.
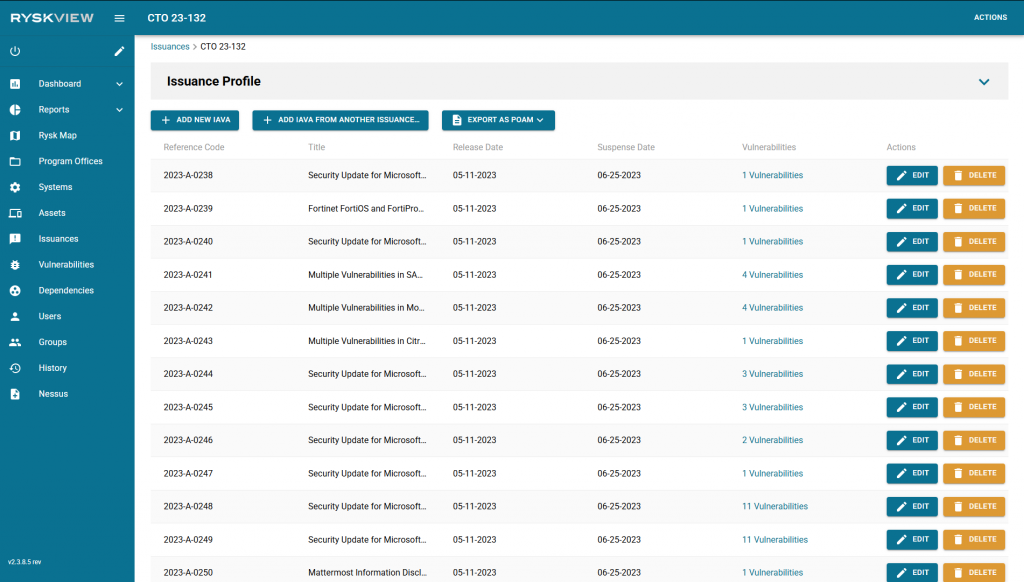
Users can add new IAVMs to the issuance by selecting the Add New IAVA button. Users can also add IAVMs for a different issuance using the Add IAVA From Another Issuance button. Issuance can be exported into a POAM using the Export As POAM button. POAMs can be exported in the eMASS v1 or eMASS v2 format.
Issuance Dashboard
On the main Issuance page, selecting the Actions button and selecting Report will take the user to the Issuance Dashboard. This page shows the compliance across the organization to the selected issuance.
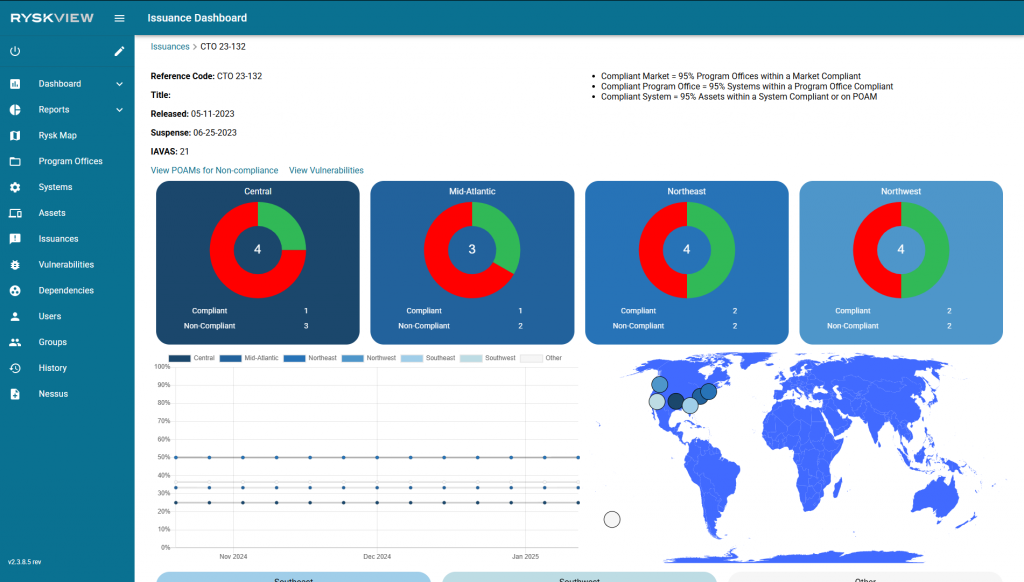
There are multiple areas to navigate to in this section. Above the rows of regional market chart graph tiles, there are two links. The “View POAMs for Non-Compliance” link will display a modal of the POAM items associated the Issuance. The “View Vulnerabilities” link will display a modal of the Program Offices and Systems that have vulnerabilities associated with the Issuance. Each tile represents a region, which show the number of compliant and non-compliant program offices for that area. Clicking on a green/red section of the pie chart will display the compliant/non-compliant program offices, respectively. The timeline shows the percentage of compliance for each market over time.